Anthropometrics and Ergonomics
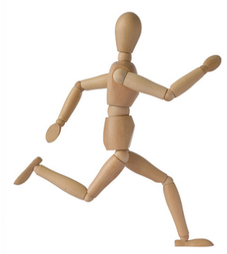
|
Anthropometry tables give measurements of different body parts for men and women, and split into different nationalities, and age groups, from babies to the elderly.
The designer needs to know exactly who or which group of people they are designing for in order to make sure the product will work with them. Examples: If you were designing an office chair, you would need to consider dimensions for adults of working age and not those for children or the elderly. If you were designing a product for the home, such as a kettle, your user group would include everyone except young children (hopefully!). Look at this website for more information. |
Percentiles
|
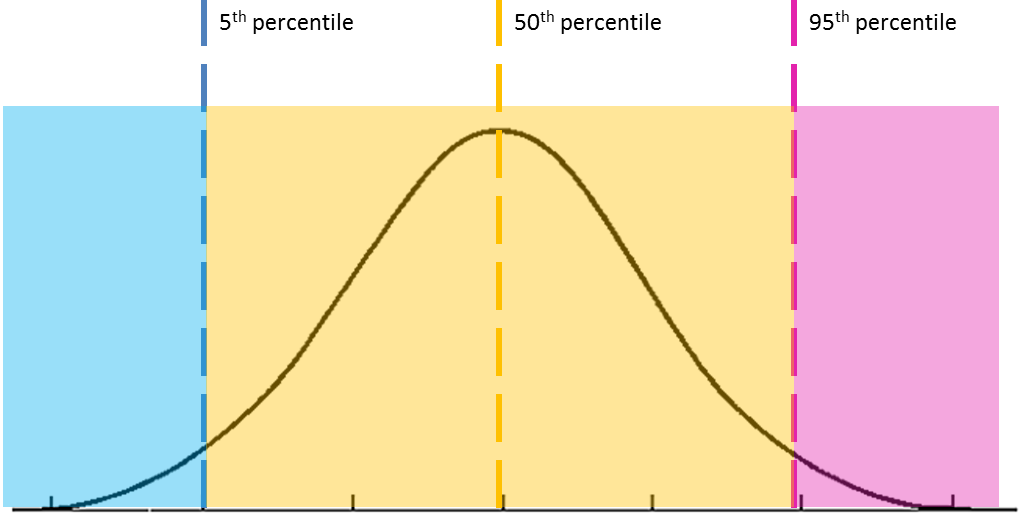
Percentiles are shown in anthropometry tables, they basically tell you whether or how a measurement given in the table compares to the average person, whether they are similar or above or below average.
For example if you looked at the height of a group of adults many will be of a similar height. There may be some people who are taller and some people who are shorter. The people all of around the same height would probably be around the 50th percentile (marked exactly halfway on the graph). The shorter people maybe marked as the 5th percentile and the taller may be the 95th percentile. If we plotted all the heights on the graph it would make a bell curve - like the example below, this is because there will be fewer people in each extreme (in this example fewer very short people and fewer very tall people). |
